| Version 9 (modified by oliver, 10 years ago) (diff) |
|---|
Contents
Web UI
Observations View
When the Statistics view provides an high-level overview of the aggregated results the Observations view is about looking into the details of Observations and the raw sensory output.
To help to coupe with amounts of data several controls are provided to help make a specific selection from a given time period and location.
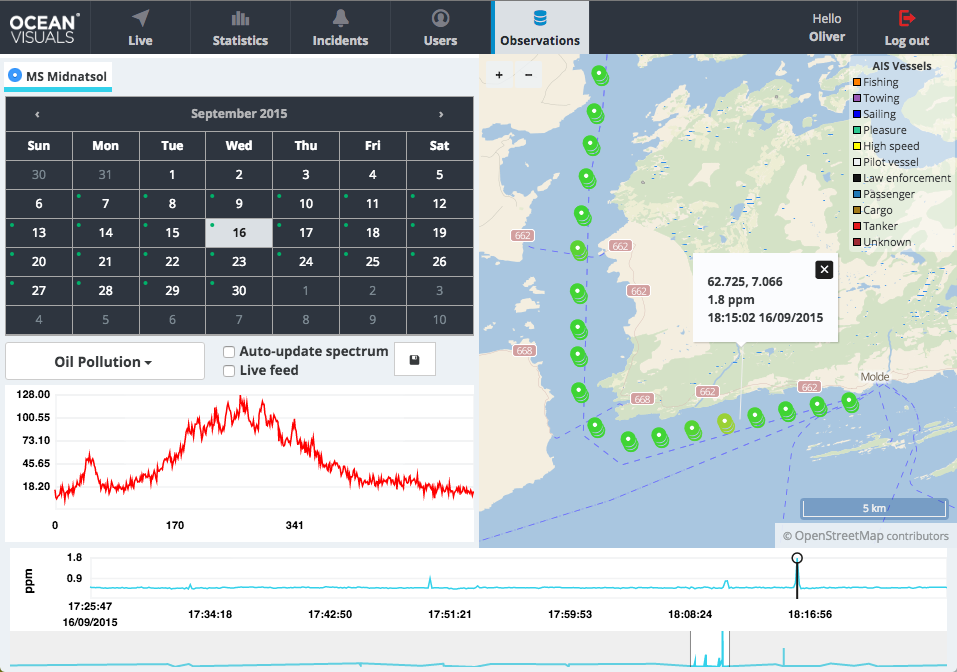
Figure 1.1 provides an annotated screenshot of the Observations view and its various controls. Figure 1.2 shows the raw data spectrum graph of an Observation that has detected oil pollution.
Figure 1.1 - Observations View - Observation without Oil Pollution
The annotated circles numbered from 1..11 can be clicked to jump to the details of each presented control.

1. Observer Selection
By default Observations are split per Observer and an Observer is always selected.
2. Date Selection (Calendar)
The calendar allows to select a date which will act as a 24 hour range for selected Observer's Observations.
A green dot icon in the calendar's date field's upper right corner indicates that the selected Observer has Observations on that date.
3. Observation Type Selection
The Observation Type for which data is loaded into the controls below.
4. Auto-update Spectrum, Live Feed Selection
When Auto-update spectrum's checkbox is ticked the spectrum of the last new Observation is loaded automatically into the 6. Raw Spectrum Graph.
When Live feed checkbox is ticked the 7. Selected Hour Plot and 10. 24h Window will start to automatically update themselves as new measurements arrive.
5. Save Spectrum to CSV
Allows to save the raw data spectrum of selected Observation as a CSV file. If no Observation is selected the button is not visible.
6. Raw Spectrum Graph
The raw data spectrum for the selected Observation Type and Observation. The spectrum presented on Figure 1.1 for Oil Pollution shows a regular spectrum pattern when no oil was found.
7. Selected Hour Plot
The hour plot presents an overview of peaks in the selected hour of the 24 hour range corresponding to the date selection in the calendar.
8. Single Observation Selector
The marker for a single selected Observation. The single Observer selection will also trigger a data update for the raw data spectrum graph and for the map, showing the Observation location.
9. Map, Location Visualization
Location visualization and Observation details on the map.
10. 24h Hour Window
The slider window representing the 24 hour range corresponding to a selected date in the calendar.
11. 1h Slide Window
The one hour slide window in the 24 hour range allowing to move back and forth in the 24 hour range.
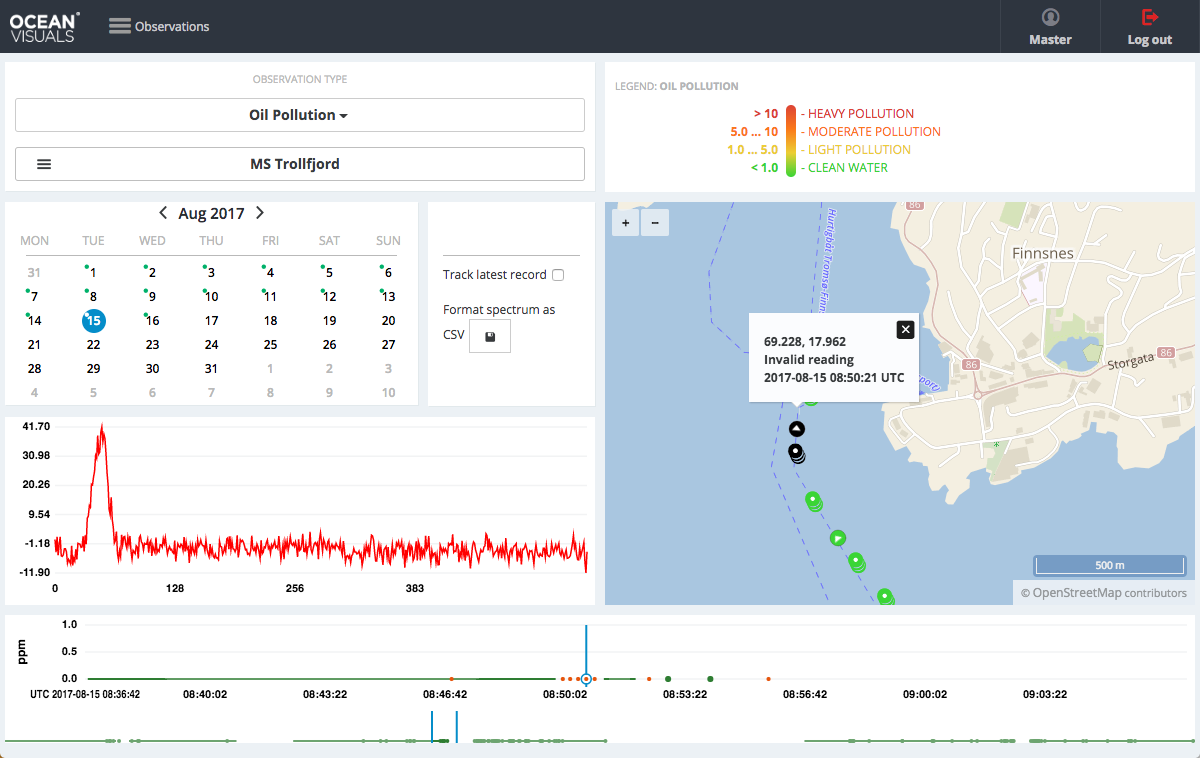
Figure 1.2 - Observations View - Observation with Oil Pollution
Attachments (7)
- ov-observations-oil-normal.png (230.1 KB) - added by oliver 10 years ago.
- ov-observations-oil-hit.png (222.1 KB) - added by oliver 10 years ago.
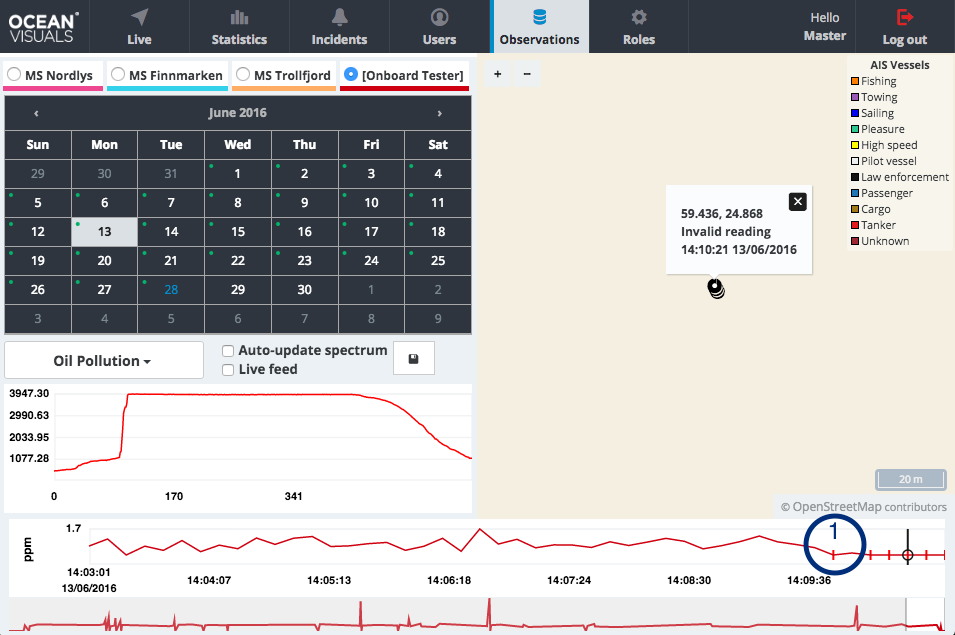
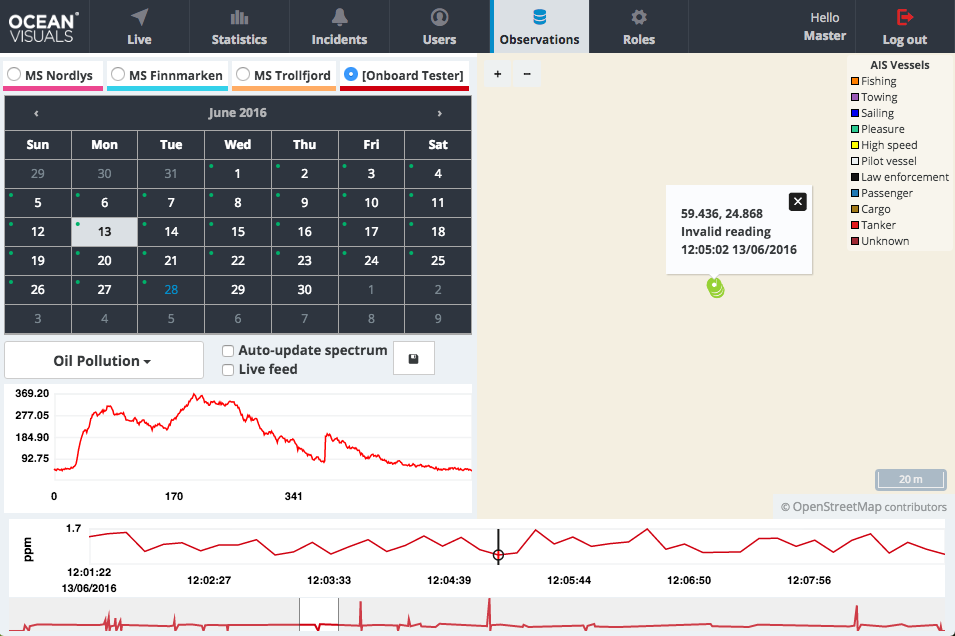
- ov-observations-invalid-reads.png (112.6 KB) - added by oliver 10 years ago.
- ov-observations-invalid-reads1.png (117.6 KB) - added by oliver 10 years ago.
- ov-observations-invalid-reads2.png (115.9 KB) - added by oliver 10 years ago.
- observations.png (265.9 KB) - added by oliver 9 years ago.
- observations_invalid_reading.png (185.3 KB) - added by oliver 9 years ago.
Download all attachments as: .zip