Welcome to Ocean Visuals Documentation
This documentation will give an overview of Ocean Visuals Web UI - the web based user interface, its concepts and features.
Terminology
- AIS - Automatic Identification System is used to provide information of nearby (to an Observer) vessel information
- Device - a device represents a physical grouping of Observation Types e.g. a LIDAR which measures: oil pollution, colored dissolved organic matter (CDOM), water transparency etc.
- Incident - a collection of Observations where a specified Observation Type is out of the normal range(s) for that specified Observation Type
- Observation - a group of measurements for one or several Observation Types at a specific time and location (latitude, longitude)
- Observation Type - a single measurable entity - an instrument / a sensor - providing a scalar value e.g. temperature, oil pollution, water transparency etc.
- Observer - a vessel or a stationary platform carrying one or several Devices for Observation gathering.
Web UI
At the highest level the Web UI functionality at an Onboard installation or at web.oceanavisuals.no is divided into 2 groups: anonymous users, public data; authenticated users, enhanced data.
Anonymous users have access to the public data and the aggregated statistics of that data.
Authenticated users have access to additional information depending on the specific installation.
Basics, Public Interface
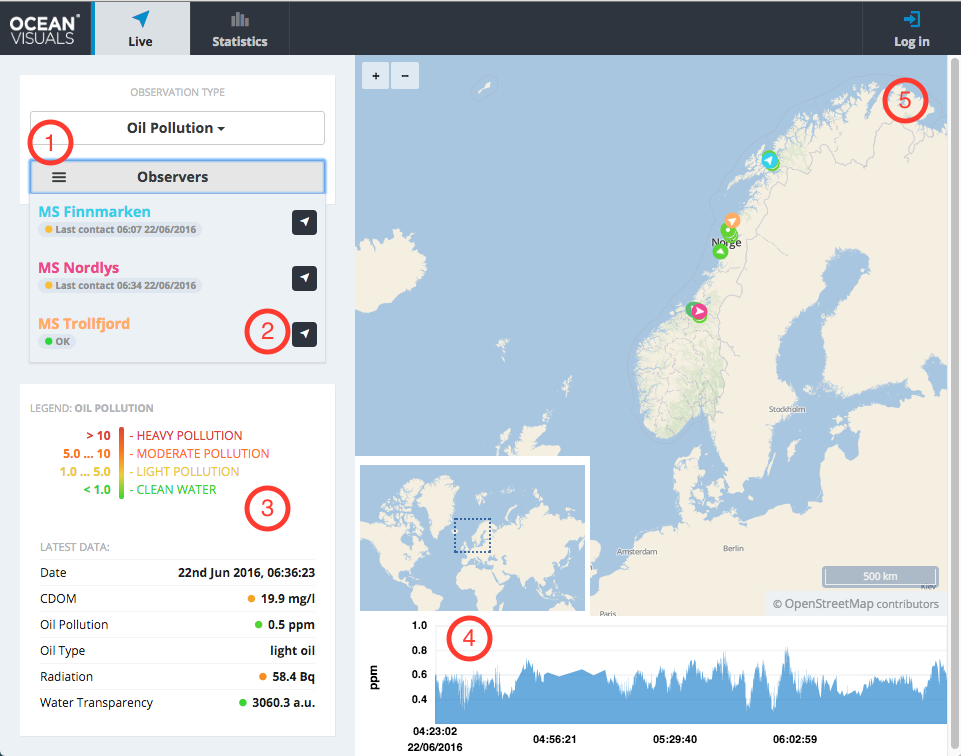
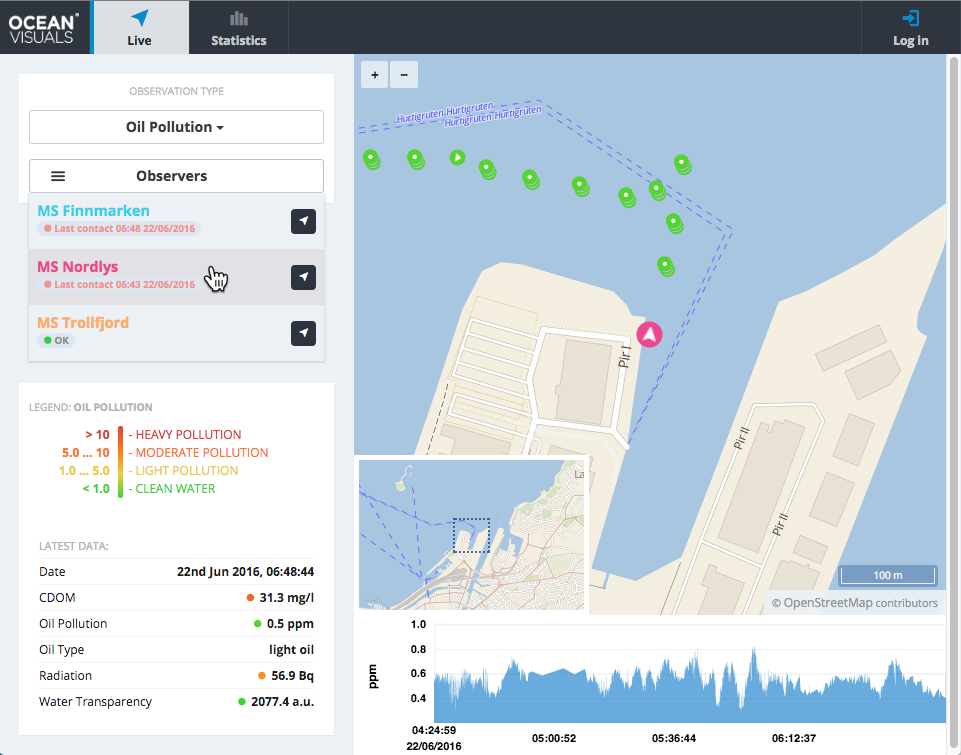
By default when opening the Web UI the Overview view is selected. The main purpose of the Overview view is to present a quick high-level overview of various Observation points and Observer position(s).
The major UI components in the Overview view, annotated in figure 1.1 are:
- Observation Type and Observer selection
- Observer tracking
- Latest Data panel
- Map
Figure 1.1 - Overview view
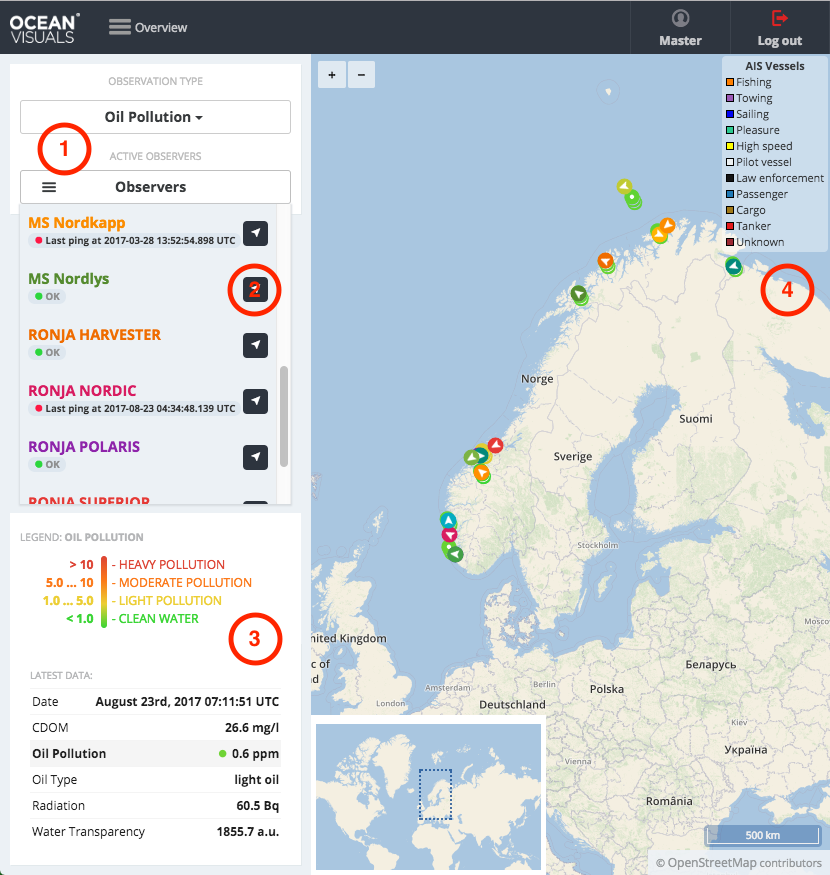
1. Observation Type and Observers Selection
The selected Observer Type in conjunction with the authentication state will determine which Observers are accessible - that is will provide data - and visible in the Observers selection and on the Map.
When opened the Observers selection provides information on:
- accessible Observers
- last contact from an Observer - if latest contact (ping) is more than 1 minute ago a specific time-stamp is shown instead of a short OK
Clicking on an Observer in the list will focus and zoom in the Map on the latest Observer position.
The latest Observer position is either the latest Observation position or (at https://web.oceanvisuals.no) the latest AIS position, whichever has the newer time-stamp.
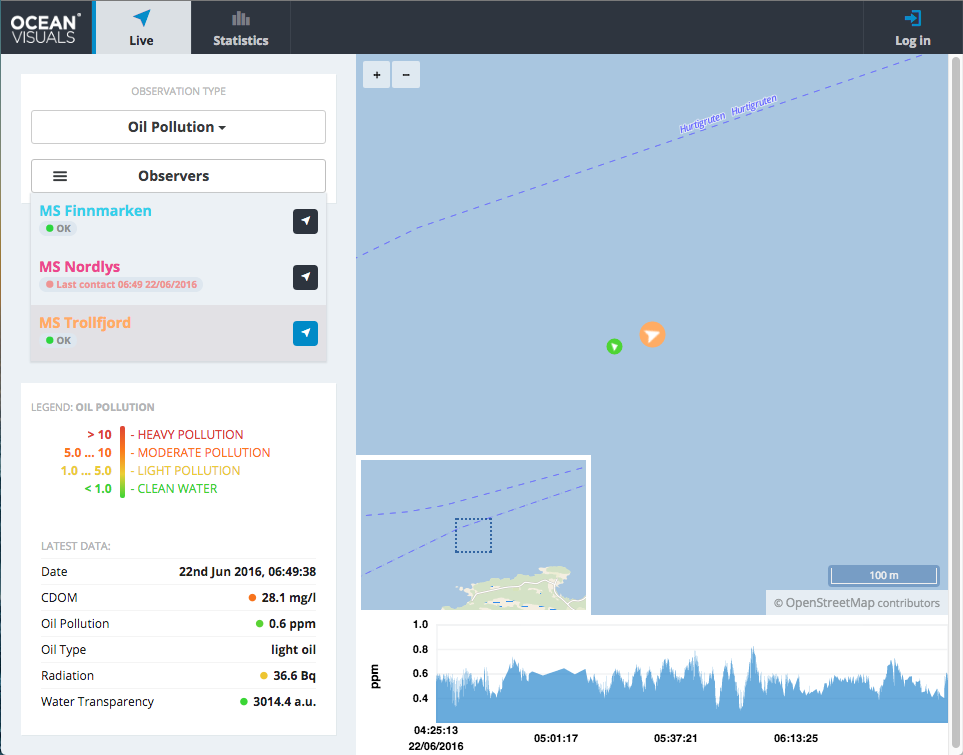
2. Observer Tracking
Enabling tracking for an Observer will focus and zoom in the Map on the selected Observer's latest position. The map will continuously update itself and "follow" the Observer's latest positions automatically on each successive position update.
3. Latest Data Panel
If no specific Observer is selected, the Latest Data Panel samples the latest Observations of all available Observation Types over all the available Observers and automatically updates itself as the Observations are coming in.
If an Observer is selected the Latest Data Panel only show the data resulting from that selected Observer.
4. Map
The Map reacts to user input from the Observation Type and Observers selection and can be navigated independently by utilizing the mouse for dragging and zooming. Explicit buttons for controlling zooming are located in the left upper corner of the Map.
NOTE: the AIS information and legend are visible only for authenticated users at https://web.oceanvisuals.no.
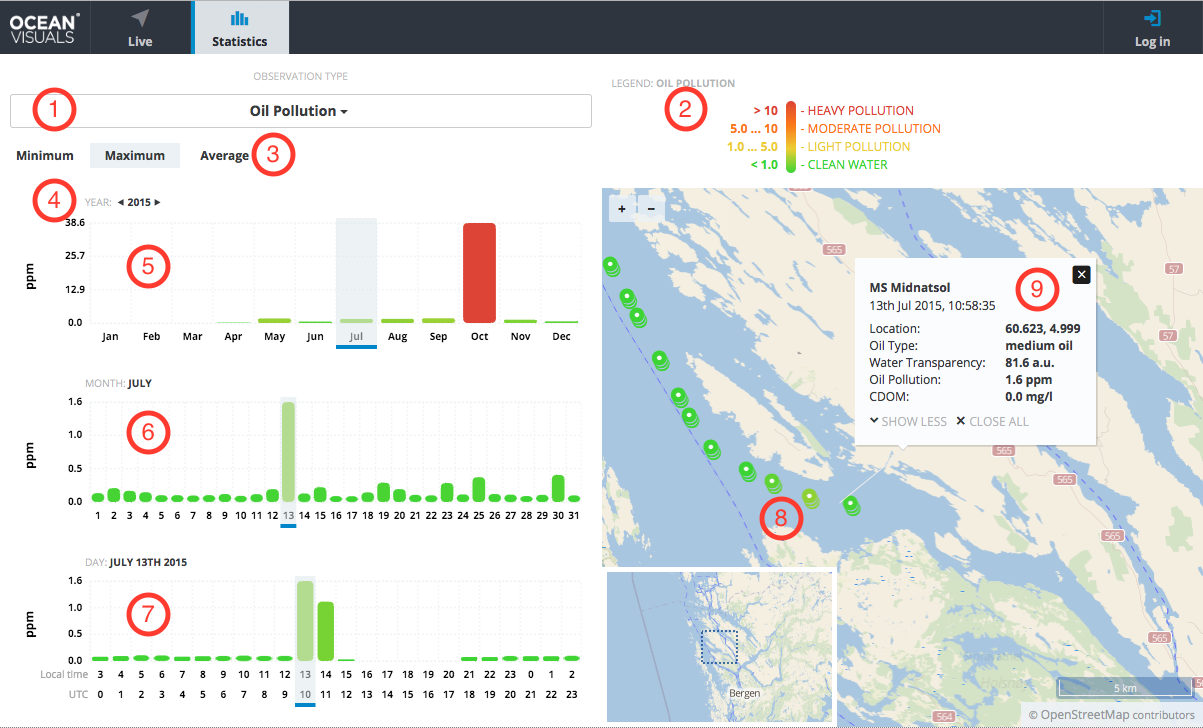
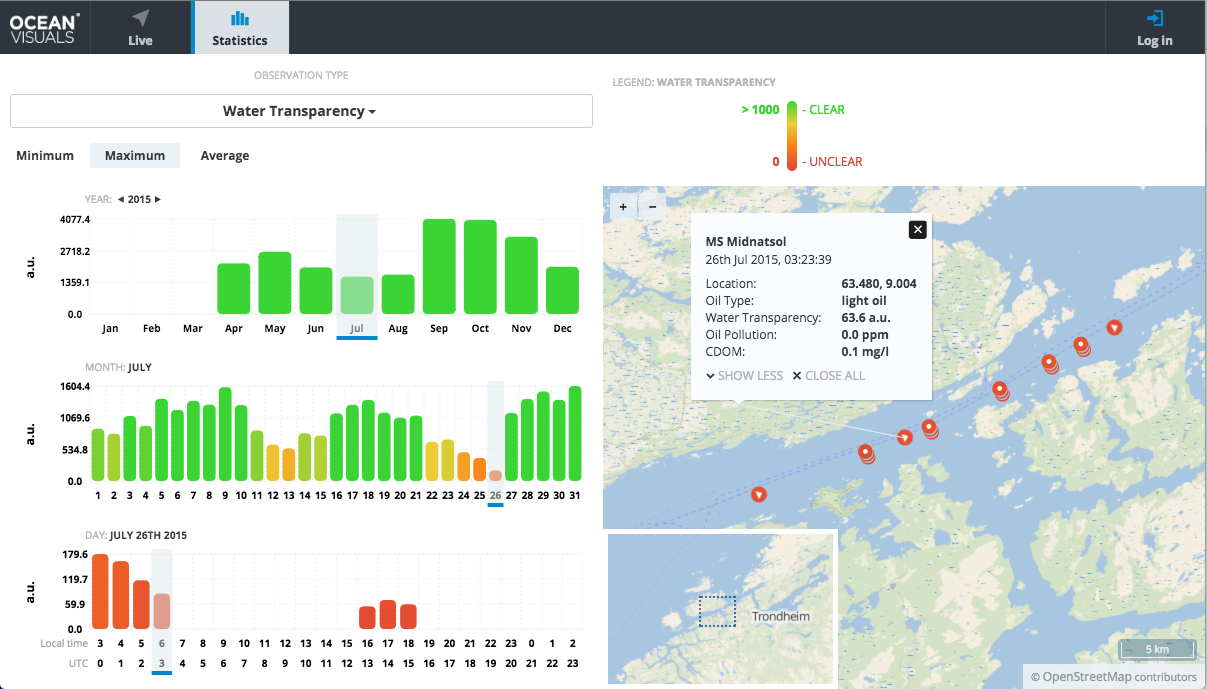
Statistics View
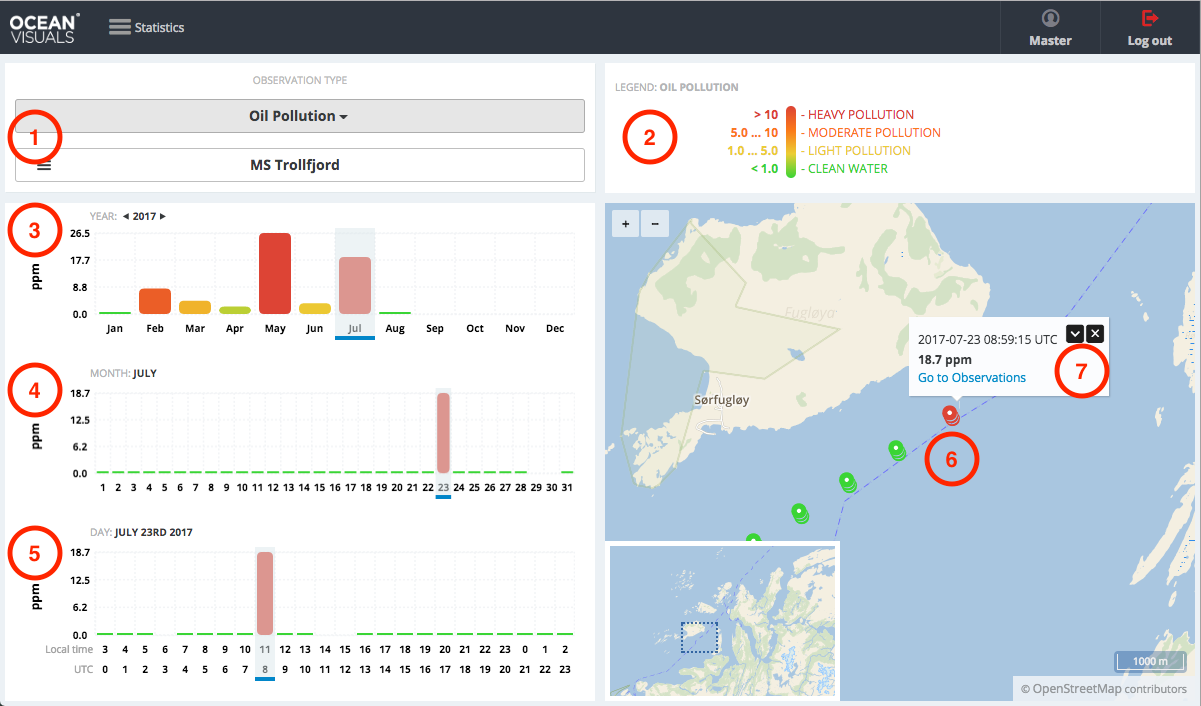
The purpose of the Statistics view is to provide an overview of aggregated Observations per selected Observation Type and year.
The major UI components in the Statistics view, annotated in figure 2.1 are:
- Observation Type selection
- Observation Type legend
- Year selection / Month selection
- Day selection
- Hour selection
- Observation selection
- Observation details
Navigation
The basic navigation pattern for Statistics view is from top left -> down -> right.
- start with the Observation Type (1), selecting the Observation Type will also update its legend (2).
- next, pick a year (3), default is the current calendar year
- depending on your interest use the Month (3), Day (4) and Hour (5) selections to filter your search
- the map on the right will update accordingly and load the Observations matching the specified Month, Day and Hour filter
- on the map click on an Observation (cluster) icon (6) to zoom in until specific Observation icons appear, clicking on the specific Observation icon will open up Observation details (7)
As in the Overview view the Map can be independently manipulated to zoom in or to zoom out on various locations of interest.
Figure 2.1 - Statistics, Oil Pollution
Onboard Operations
An authenticated onboard operator (on a Vessel) has access to additional functionality:
- Geofencing
- Incident view
- Observations view
- Devices view
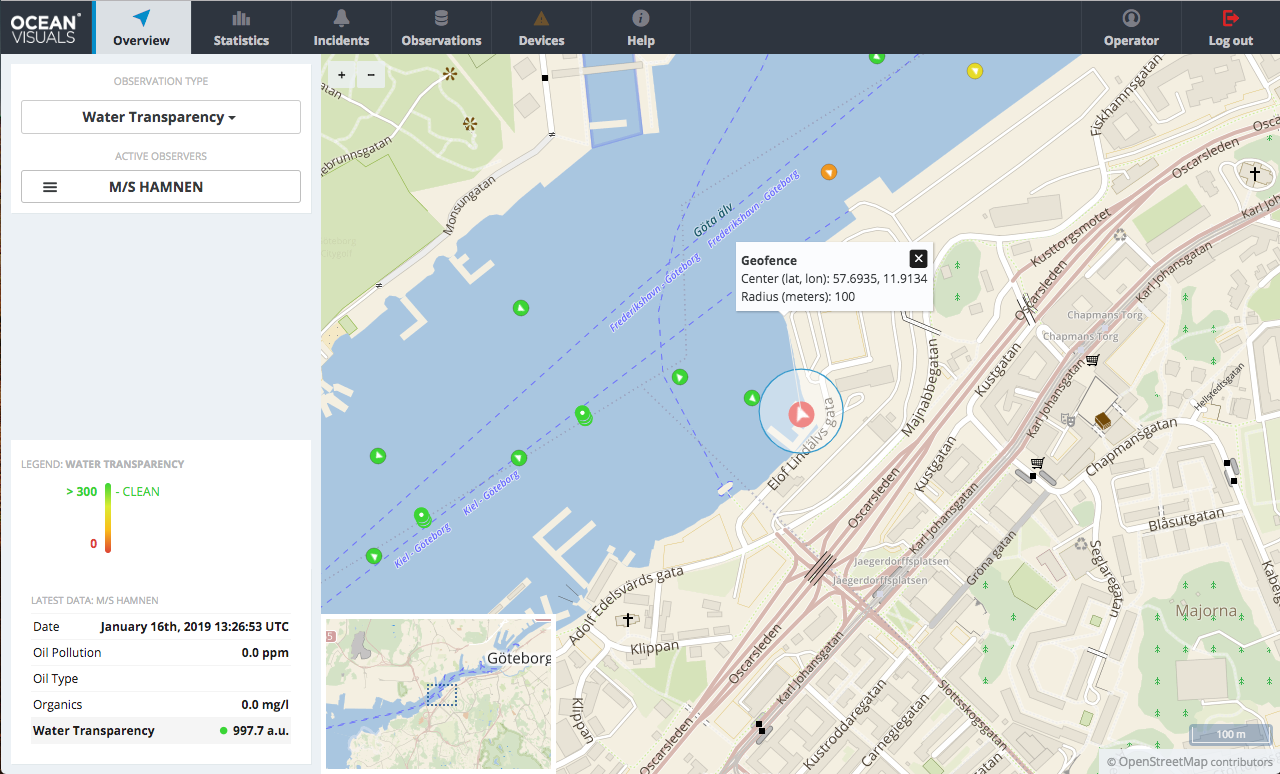
Geo-fencing
When geofencing is enabled it will override some manual Device mode operations inside and/or outside of a geofence.
For example, when a geofence's "inside state" is configured to turn the Device off, a manual Device mode change to Normal or Fast may trigger and Observation, but the next GPS update received from the Device will re-active the geofence's "inside state" and turn the Device off again.
In the same way, when a geofence's "outside state" is configured to turn the Device on, a manual Device mode change to Off will only turn the Device off for a brief period, until the next GPS update arrives from the Device and re-activates the geofence's "outside state".
At present a fixed set of preconfigured geofences is provided. Additions and/or removals to the list of geofences is done by Ocean Visuals personnel, due to the intricacies of configuring the Device states properly.
For requesting additional geofences, please compile a list of GPS coordinates (latitude, longitude - degrees, WGS84) + radius and send it to webmaster{at}oceanvisuals{dot}no.
Figure 3.1 Vessel position at pier inside a geofence
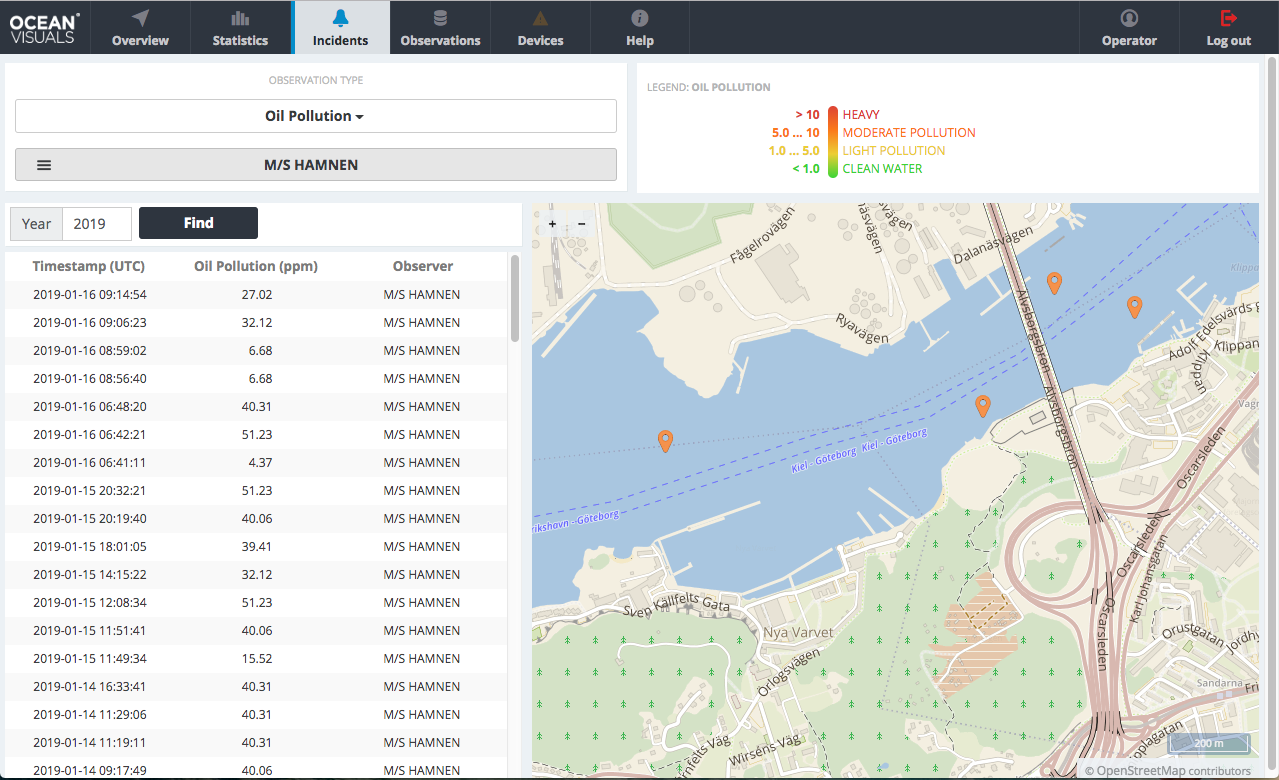
Incidents
The Incidents view provides access an overview of aggregated Incidents and shows the locations of the Observations, outside of their normal range(s), that make up an Incident.
At present, Incident Observation location correlation with AIS information (other nearby Vessels) is not available at Onboard installations.
Figure 4.1 Aggregated Incidents
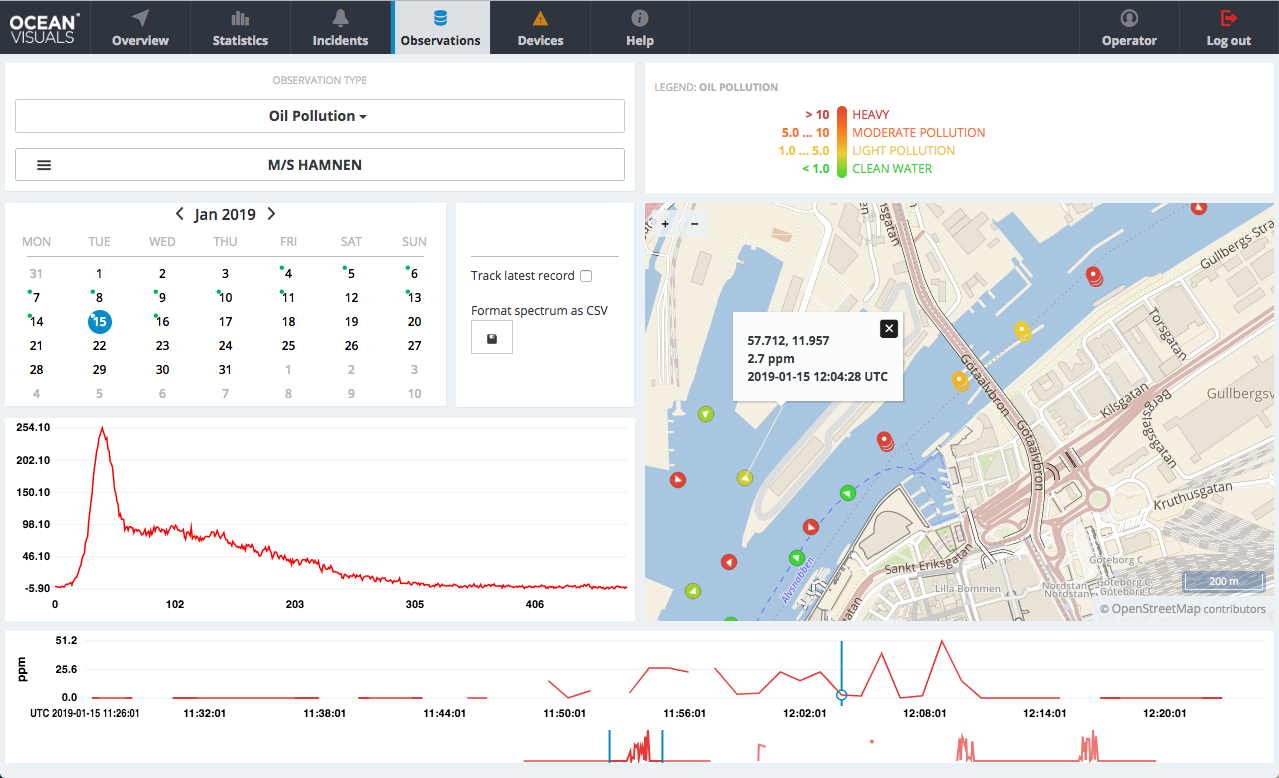
Observations
When the Statistics view provides an high-level overview of the aggregated results the Observations view is about looking into the details of Observations and the raw sensory output.
To help to coupe with amounts of data several controls are provided to help make a specific selection from a given time period and location.
Figure 5.1 provides an annotated screenshot of the Observations view and its various controls. Figure 1.2 shows the raw data spectrum graph of an Observation that has detected oil pollution.
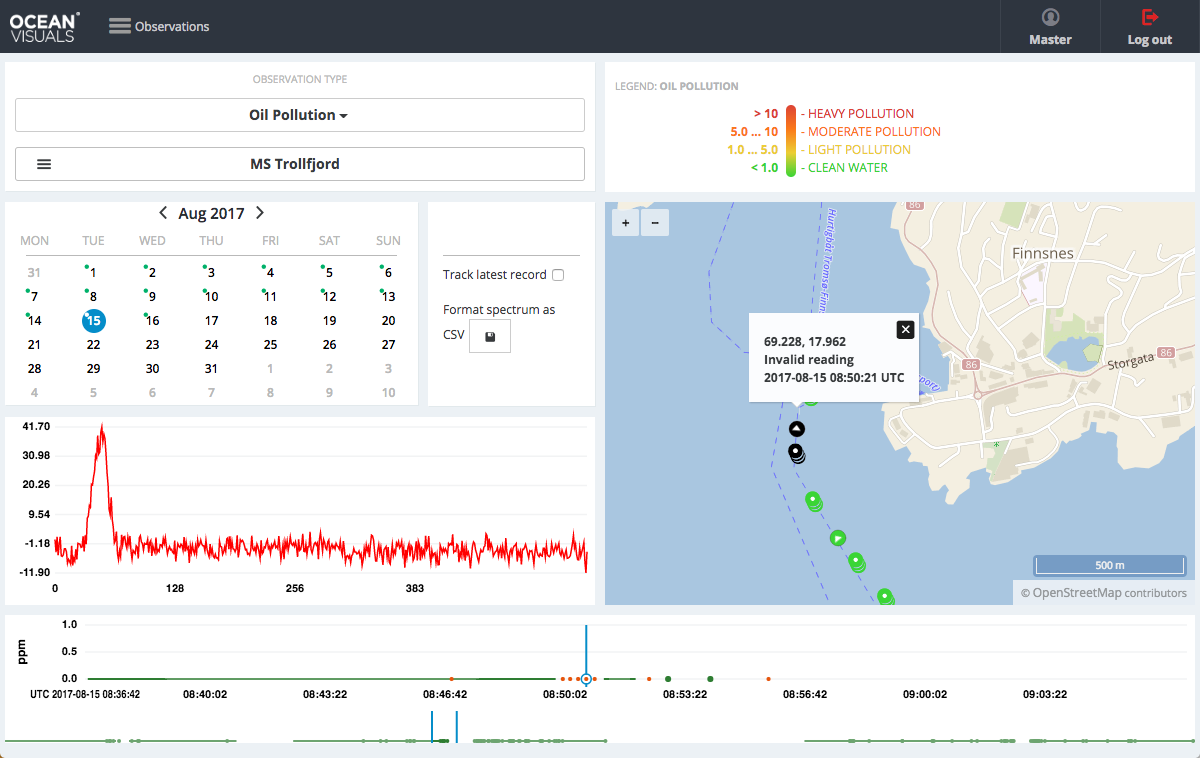
The figure 5.2 demonstrates raw data spectrum graphs of invalid Observations. Frequent invalid observations are a sign of device failure or of an approaching maintenance window.
Figure 5.1 - Observations View - Observation without Oil Pollution
The annotated circles numbered from 1..8 can be clicked to jump to the details of each presented control.
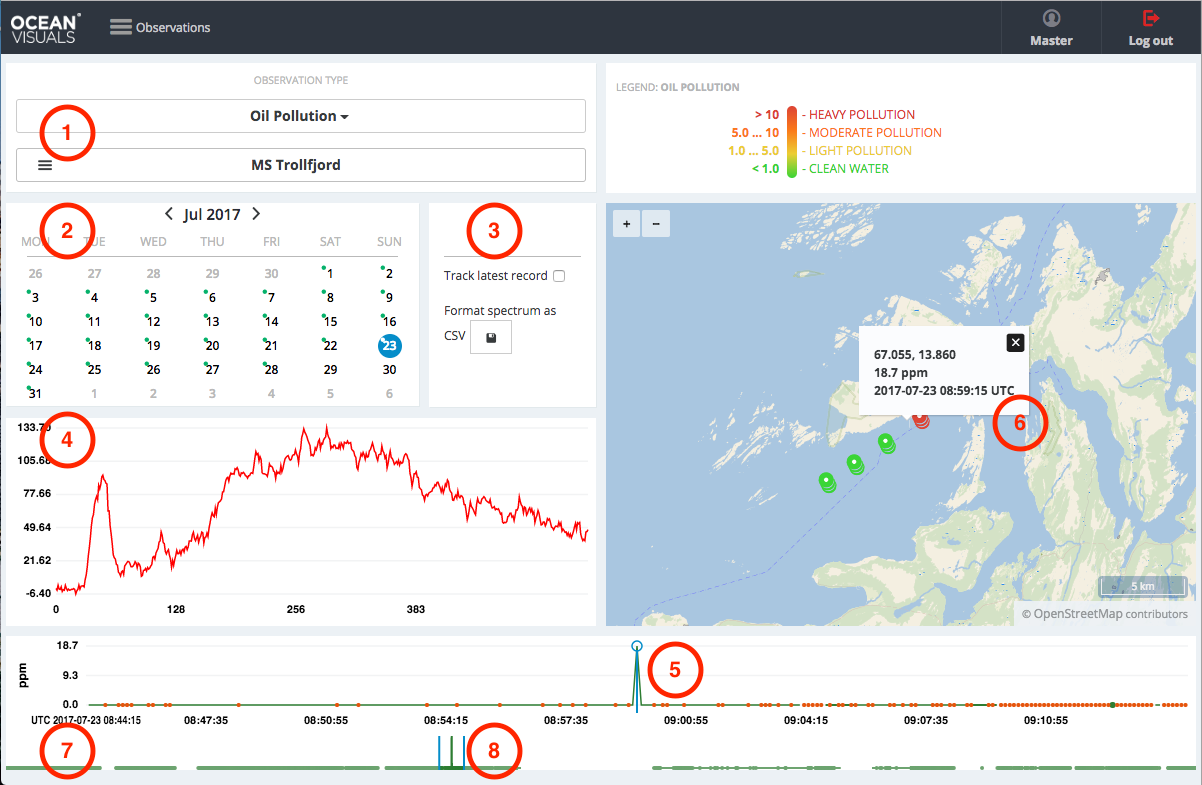
1. Observer Selection
By default Observations are split per Observer and an Observer needs to be selected to visualize data.
2. Date Selection (Calendar)
The calendar allows to select a date which will act as a 24 hour range for selected Observer's Observations.
A green dot icon in the calendar's date field's upper right corner indicates that the selected Observer has Observations on that date.
3. Track latest record, Format spectrum as CSV
When Track latest record checkbox is ticked the spectrum of the last new Observation is loaded automatically into the Raw Spectrum Graph.
Also the Selected Hour Plot and 24h Window will start to automatically update themselves as new measurements arrive.
The Format spectrum as CSV allows to save the raw data spectrum of selected Observation as a CSV file. If no Observation is selected the button is not visible.
4. Raw Spectrum Graph
The raw data spectrum for the selected Observation Type and Observation. The spectrum presented on Figure 1.1 for Oil Pollution shows a spectrum pattern when oil was found.
5. Selected Hour Plot / Single Observation Selector
The hour plot presents an overview of peaks in the selected hour of the 24 hour range corresponding to the date selection in the calendar.
The marker for a single selected Observation. The single Observer selection will also trigger a data update for the raw data spectrum graph and for the map, showing the Observation location.
6. Map, Location Visualization
Location visualization and Observation details on the map.
7. 24h Hour Window
The slider window representing the 24 hour range corresponding to a selected date in the calendar.
8. 1h Slide Window
The one hour slide window in the 24 hour range allowing to move back and forth in the 24 hour range.
Figure 5.2 - Observations View - Invalid Observations
The screenshot below shows how invalid Observations are presented on the Selected Hour Plot as separate red dot.
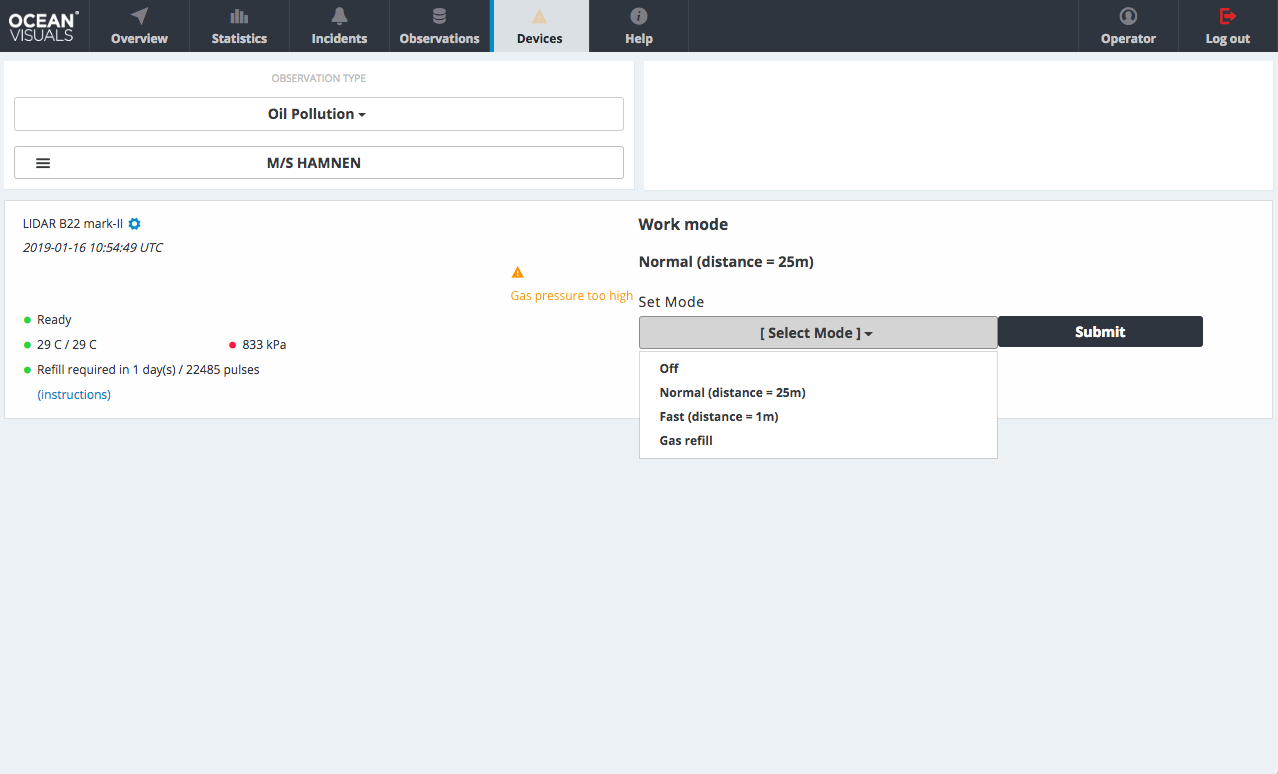
Devices
The Devices view is for monitoring Device health, gas refill operations and manual Device mode overrides.
By default the a Device is configured to run in its Normal mode. Which will trigger the Device to take a measurement every N meters accordingly to the Device's GPS data.
The length of N will depend on the length of the Observer to which a Device is mounted.
When an Incident is detected the Device will automatically switch to Fast mode for 30 seconds. If during that 30 seconds new Incident Observations are found the timer is reset. That is the Device will keep operating in Fast mode. If during the 30 second window no more Incident Observations are found, the Device will switch back to Normal mode.
For search and Incident (e.g. oil spill area) detection, the Device can be switched manually to Fast mode.
Gas Refill
The gas refill operations required for the normal operation of a Device, are normally performed by Ocean Visuals personnel.
Notification of upcoming gas refill operations is normally not required. The exception being, unexpected or scheduled power outages, as during a gas refill operation a power outage can damage the Device.
Notices of Vessel's power outages can be sent to webmaster{at}oceanvisuals{dot}no.
Figure 6.1 Devices
Attachments (14)
- ov-live-view.png (198.9 KB) - added by oliver 10 years ago.
- ov-live-view-vessel-click.png (216.1 KB) - added by oliver 10 years ago.
- ov-live-view-tracking.png (114.9 KB) - added by oliver 10 years ago.
- ov-stats-oil.png (358.8 KB) - added by oliver 10 years ago.
- ov-stats-cdom.png (466.6 KB) - added by oliver 10 years ago.
- ov-stats-wt.png (455.2 KB) - added by oliver 10 years ago.
- overview.png (437.1 KB) - added by oliver 9 years ago.
- statistics.png (201.8 KB) - added by oliver 9 years ago.
- mshamnen_demo_geofence.png (647.0 KB) - added by oliver 8 years ago.
- mshamnen_demo_incidents.png (483.1 KB) - added by oliver 8 years ago.
- mshamnen_demo_observations.png (380.0 KB) - added by oliver 8 years ago.
- mshamnen_demo_devices.png (80.6 KB) - added by oliver 8 years ago.
- observations.png (265.9 KB) - added by oliver 8 years ago.
- observations_invalid_reading.png (185.3 KB) - added by oliver 8 years ago.
Download all attachments as: .zip