| Version 1 (modified by oliver, 10 years ago) (diff) |
|---|
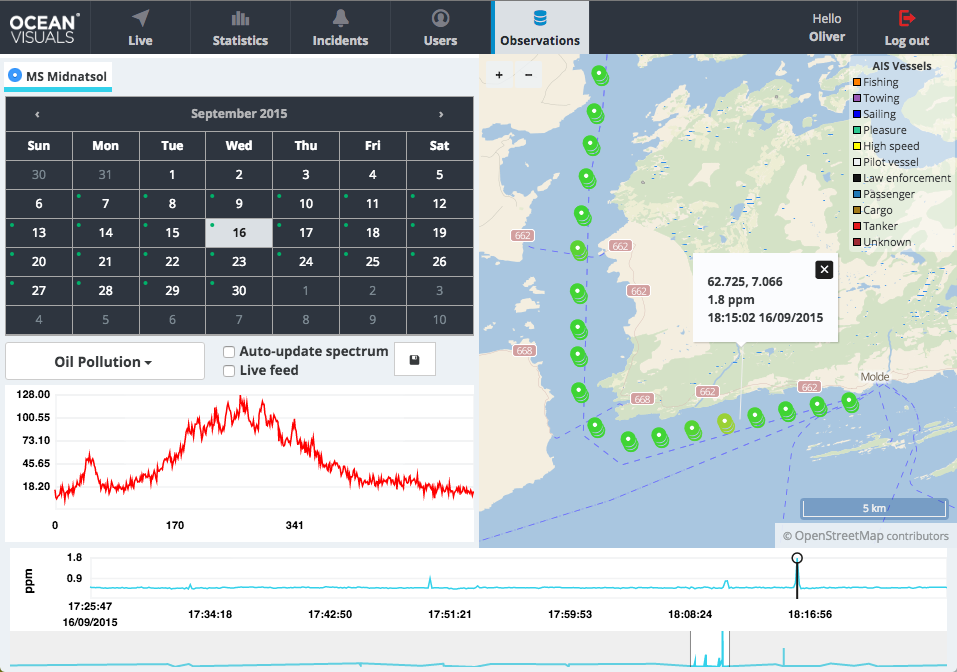
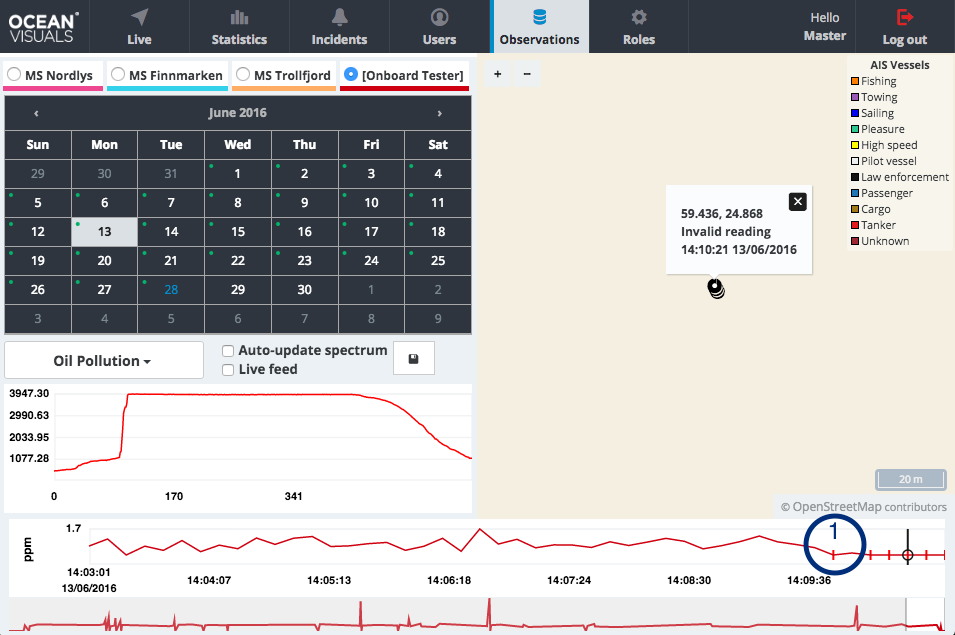
Observations View
When the Statistics view provides an high-level overview of the aggregated results the Observations view is about looking into the details of Observations and the raw sensory output.
UI components
To help to coupe with amounts of data several controls are provided to help make a specific selection from a given time period and location.
1. Observer Selection
2. Date Selection (Calendar)
3. Observation Type Selection
4. Auto-update Spectrum, Live Feed Selection
5. Save Spectrum to CSV
6. Raw Spectrum Graph
7. Selected Hour Plot
8. Single Observation Selector
9. 24h Hour Window
10. 1h Slide Window
11. Map, Location Visualization
Attachments (7)
- ov-observations-oil-normal.png (230.1 KB) - added by oliver 10 years ago.
- ov-observations-oil-hit.png (222.1 KB) - added by oliver 10 years ago.
- ov-observations-invalid-reads.png (112.6 KB) - added by oliver 10 years ago.
- ov-observations-invalid-reads1.png (117.6 KB) - added by oliver 10 years ago.
- ov-observations-invalid-reads2.png (115.9 KB) - added by oliver 10 years ago.
- observations.png (265.9 KB) - added by oliver 9 years ago.
- observations_invalid_reading.png (185.3 KB) - added by oliver 9 years ago.
Download all attachments as: .zip